Problems Need a Red Hat
Data indicating problems needs to shout through visualization.


Data indicating problems needs to shout through visualization.
At Boeing, using data to gain deeper insights into problems is common. But there is a higher bar for what results in a “design-affecting decision.”

Once your data reaches certain size, you are effectively forced to visualize it.

Looking at data? Separate weekends, use Tuesdays.

Building a good visualization requires iteration as you work with the data.
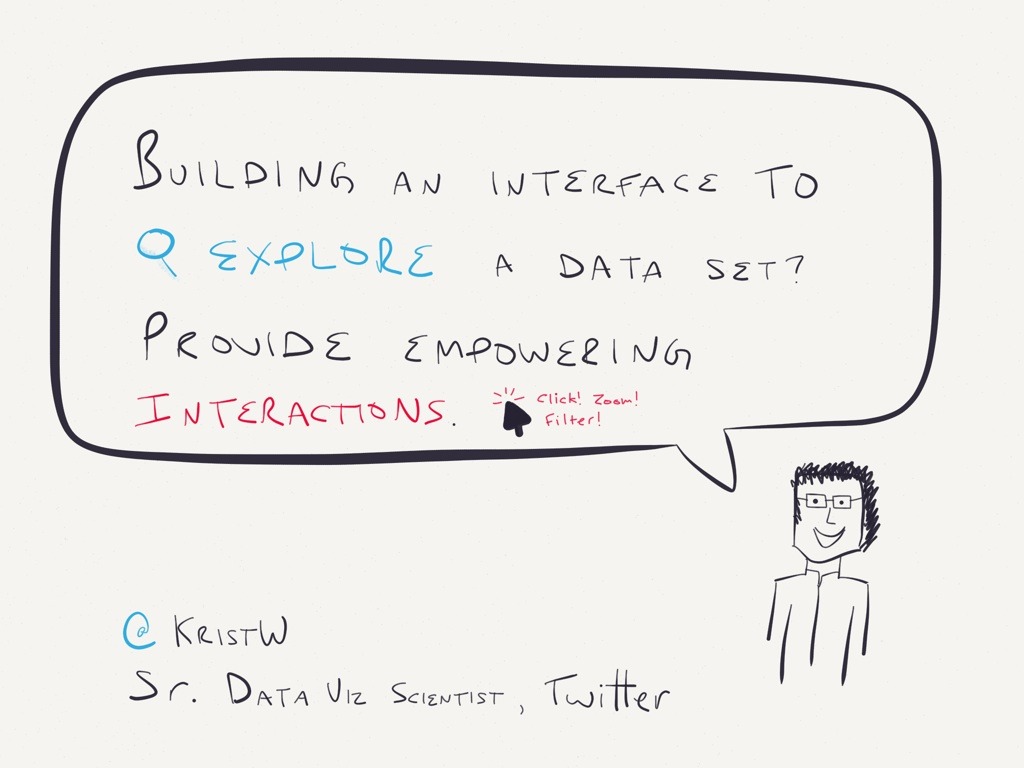
Exploring data requires interaction.

Are you exploring or reporting? What’s your goal?